Author: Public Art Chattanooga
Publication Year: 2017
Media Type: Sample document
Public Art Chattanooga and the Steering Committee for the Fallen Five Memorial seek artist led multi-disciplinary design team’s artistic qualifications to commemorate the fatal shootings of five servicemen on July 16, 2015, through a permanent…
Categories: Public Art
Author: Americans for the Arts
Publication Year: 2017
Media Type: Infographic
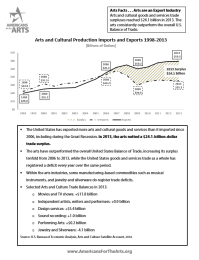
The arts have outperformed the overall United States Balance of Trade, increasing its surplus tenfold from 2006 to 2013, while the United States goods and services trade as a whole has registered a deficit every year over the same period.
Categories: Advocacy, Economic Impact, Federal, International
Author: Americans for the Arts
Publication Year: 2017
Media Type: Infographic
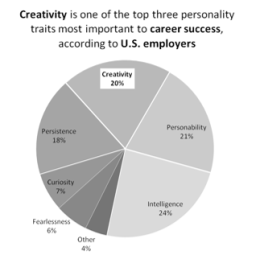
Schools and employers rank a degree in the arts among the most significant indicator of a job candidate’s creativity and innovation skills.
Categories: Advocacy, Arts Action Fund, Arts Facts, Creative Workforce, Private Sector
Author: Americans for the Arts
Publication Year: 2017
Media Type: Infographic
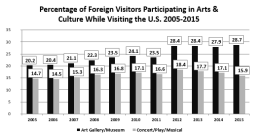
Cultural travelers—both domestic and international—are ideal tourists. They spend more money and stay at their destinations longer.
Categories: Advocacy, Economic Impact, Tourism
Author: Americans for the Arts
Publication Year: 2017
Media Type: Infographic
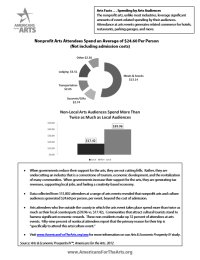
The nonprofit arts, unlike most industries, leverage significant amounts of event-related spending by their audiences. Attendance at arts events generates related commerce for hotels, restaurants, parking garages, and more.
Categories: Advocacy, Arts Facts, Creative Economies, Creative Industries, Economic Impact, Tourism
Author: Arts & Business Council of New York
Publication Year: 2017
Media Type: Infographic
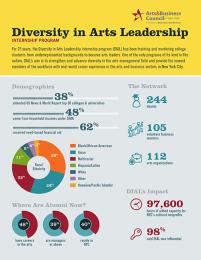
Capturing 25 years of our Diversity in Arts Leadership Internship Program Impact through this infographic!
Categories: Access and Equity, Creative Industries, Creative Workforce, Cultural Diversity, Leadership, Partnerships, Private Sector, Professional Development
Author: Americans for the Arts
Publication Year: 2017
Media Type: Infographic
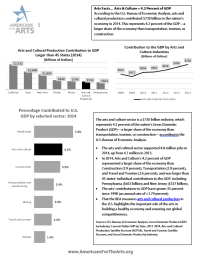
The arts and culture sector is a $730 billion industry, which represents 4.2 percent of the nation’s Gross Domestic Product (GDP)—a larger share of the economy than transportation, tourism, or construction—according to the U.S. Bureau of Economic…
Categories: Advocacy, Arts Action Fund, Arts Facts, Economic Impact
Author: Americans for the Arts
Publication Year: 2017
Media Type: Infographic
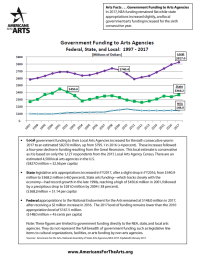
Government Funding to Arts Agencies, Federal, State, and Local: 1997 - 2017
Categories: Advocacy, Arts Action Fund, Arts Facts, Funding, Fundraising
Author: Americans for the Arts
Publication Year: 2017
Media Type: Infographic
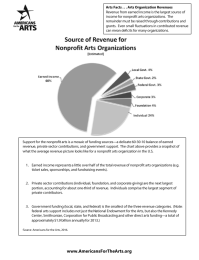
Support for the nonprofit arts is a mosaic of funding sources—a delicate 60-30-10 balance of earned revenue, private sector contributions, and government support. The chart above provides a snapshot of what the average revenue picture looks like…
Categories: Advocacy, Arts Facts, Funding, Fundraising, Local Arts Agencies
Author: All-Party Parliamentary Group on Arts, Health and Wellbeing
Publication Year: 2017
Media Type: Report
This 2017 study out of the UK is the result of a three-year inquiry into the state of practice and research at the intersection of the arts and social care and provides recommendations on improvements of policy and practice.
Categories: Aging