Author: Kara Bruney
Publication Year: 2017
Media Type: Infographic
Summary:
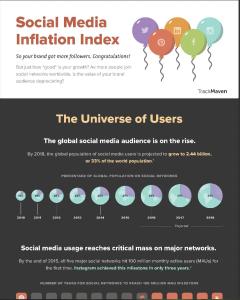
Just how good is your growth? As more people join social networks worldwide, is the value of your brand audeince depreciating?
Abstract:
"Call it social media inflation. Nominally, you may have a lot more followers this year — but if your audience growth didn’t outpace the competition or the industry average, then the value of your social audience likely depreciated.
Sure, some brands grow “smarter” than others. Sweepstakes and giveaways, for example, might result in more followers, but are less likely to convert “likes” into loyal customers. But without historical and competitive context, reporting on follower growth is an empty, self-congratulatory exercise.
Enter the 2016 Social Media Inflation Index. We used the TrackMaven digital analytics software platform to analyze a sample of 26,965 brands across all industries. The results, presented in the summary graph below, display the median monthly follower growth percentage per brand on five major social networks — Facebook, Twitter, Instagram, LinkedIn, and Pinterest — across 2015."
Arts & Intersections: Technology
Categories: Marketing and Communications
ADDITIONAL BIBLIOGRAPHICAL INFORMATION
PUBLISHER INFORMATION
Name: TrackMaven
Website URL: https://trackmaven.com